
The price to rent ratio 2026 numbers tell a different story than they did just a few years ago. The ratio itself compares home prices to annual rent to show whether buying or renting makes more financial sense in a given market. But the classic rule for reading it under 15, buy; above 20, rent no longer holds up, because higher mortgage rates and rising ownership costs have changed what those numbers actually mean. A ratio that pointed toward buying in 2019 can point the opposite way today, even though the calculation itself hasn’t changed at all.
This guide breaks down the price to rent ratio 2026 picture for five major markets, and the five-step process worth using in place of the old rule.
What the Price-to-Rent Ratio Actually Measures
The price-to-rent ratio compares the cost of buying a home to the cost of renting an equivalent one in the same market:
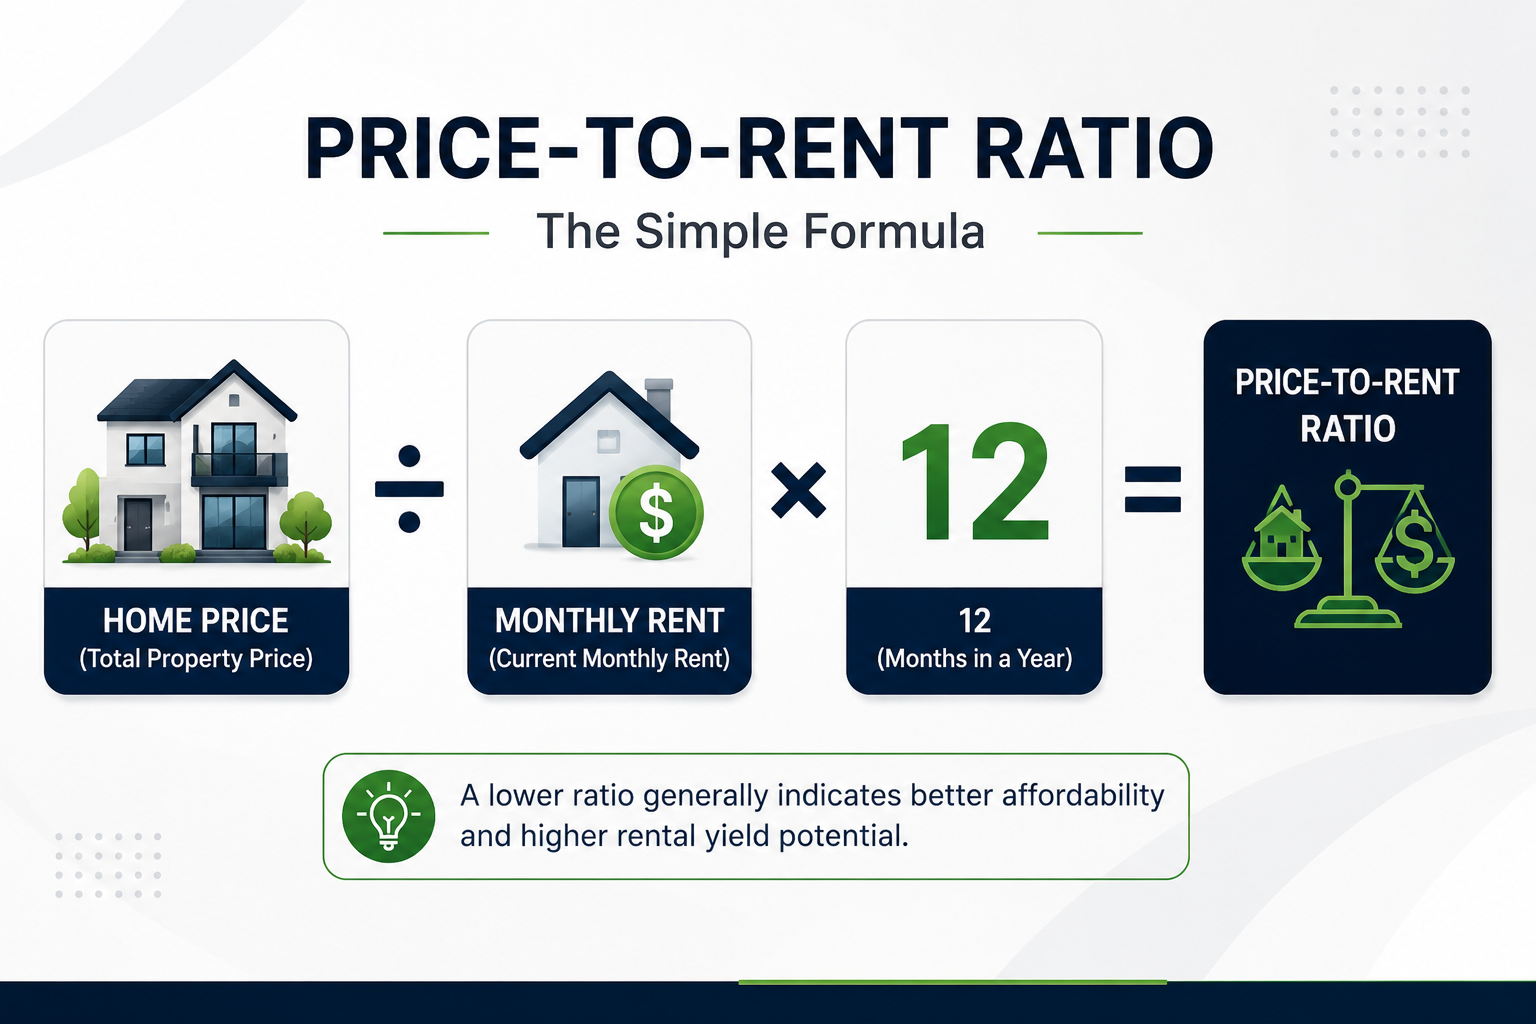
Price-to-Rent Ratio = Home Price ÷ (Monthly Rent × 12)
Take a $400,000 home renting for $1,800 a month ($21,600 a year): 400,000 ÷ 21,600 = 18.5.
Under the old rule, that’s grey-zone territory not a clear buy or rent signal. In 2026, the honest answer is that the number alone was never going to tell you enough, and the gap between “technically calculable” and “actually useful” has only widened.
Why the 2026 Price-to-Rent Rule Stopped Working
The classic thresholds rested on one assumption: cheap financing. Take that assumption away, and the rule falls apart in four distinct ways.
Mortgage Rates Moved, and the Math Didn’t Catch Up
When rates sat near 3%, a ratio of 18 genuinely favored buying the monthly payment on that math was competitive with rent. At 6–7% or higher, that same ratio produces a payment that runs well past what renting the same place would cost. The formula hasn’t changed. The inputs underneath it have.
The Ratio Ignores Most of What Owning Actually Costs
Property taxes, home insurance, maintenance (typically modeled at around 1% of home value a year), HOA or condo fees, and closing costs that can run 10–15% of the purchase price in some markets none of that shows up in the basic calculation. Once you add it in, true monthly ownership cost often runs 25–40% above the mortgage payment alone.
One Global Threshold Can’t Describe Every Market
A ratio that signals “buy” in Kansas City says nothing useful about London, and a healthy number in Munich doesn’t translate to Moscow. National averages flatten these differences into a single, misleading figure; the US national average, for instance, buries the gap between a ratio of roughly 12 in Cleveland and well over 30 in San Francisco.
Rents and Prices Have Stopped Moving Together
Several Canadian cities saw asking rents soften through 2025–26 as new supply came online, while purchase prices held. In parts of Germany, rents crept up slowly even as prices stayed firm. In the UK, rent growth outpaced wages in some regions and went flat in others. When the two sides of the ratio stop moving together, a single snapshot number becomes a picture of a market that’s already moved on.
Worth knowing: ratios can swing by 5–8 points between a city center and its own suburbs. If you’re calculating this for a real decision, do it for your specific neighborhood, not your metro average, and not your country average.
Price-to-Rent Ratio 2026 by Country: Five Different Reasons It Misleads
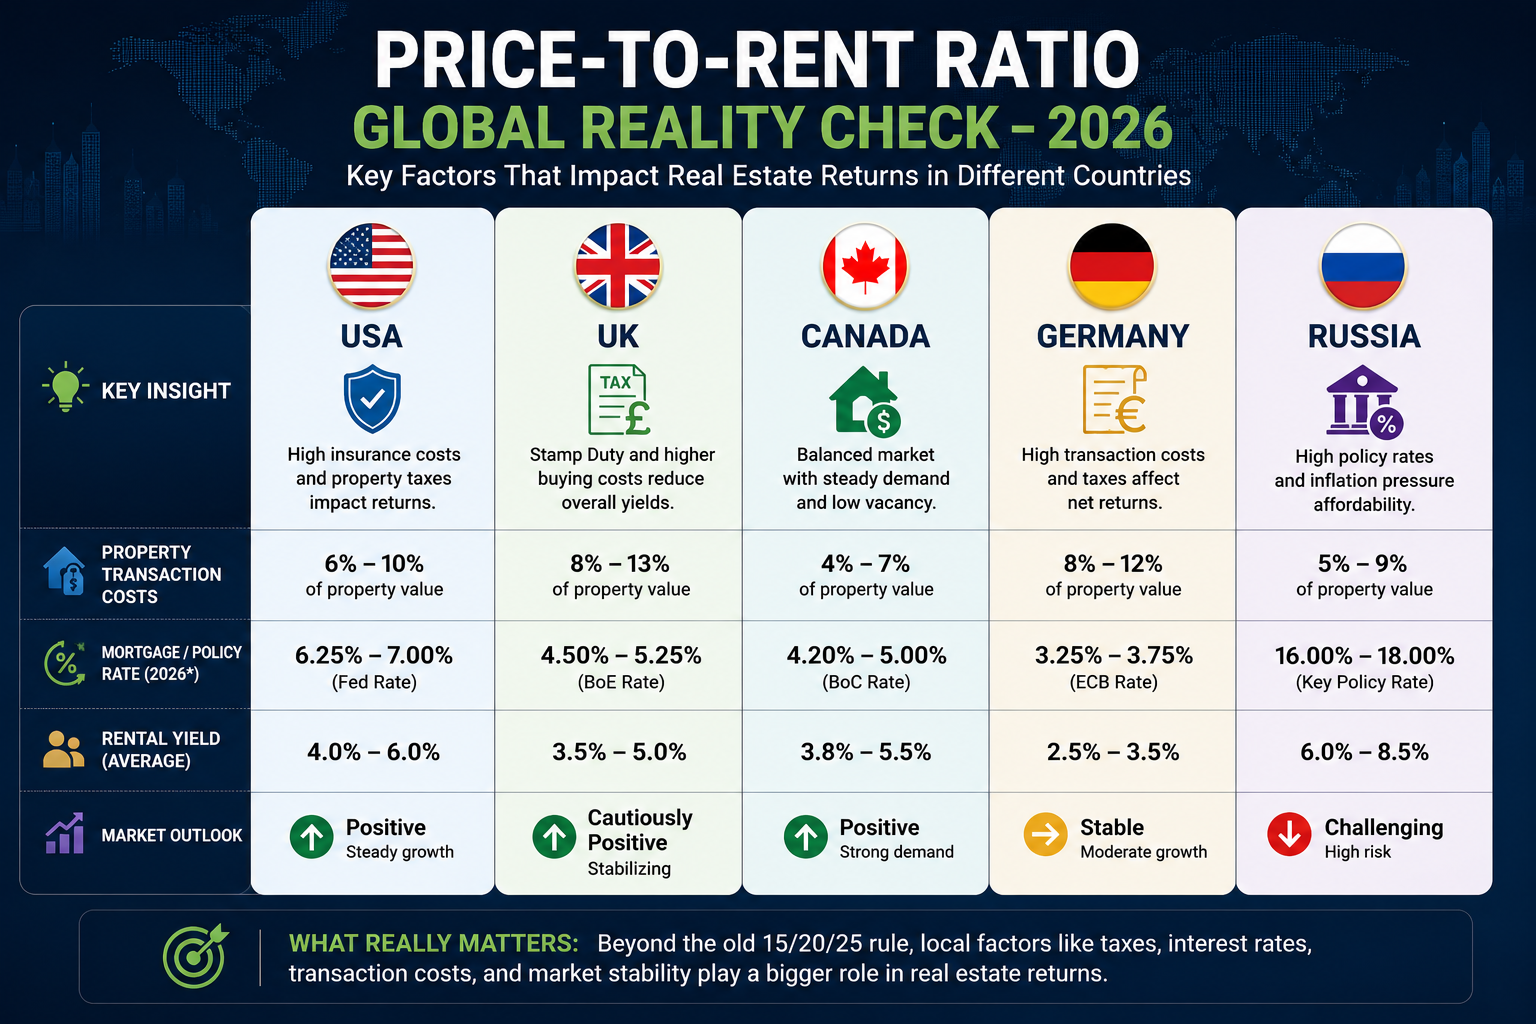
Ratios remain elevated across the US, UK, Canada, Germany, and Russia by historical standards in most cases, full ownership costs still exceed renting on a monthly basis, especially in major cities. The OECD’s cross-country housing data shows this isn’t a one-market story: every major economy is dealing with the same disconnect between price and rent, just for different reasons. Here’s the price-to-rent ratio 2026 breakdown, market by market.
United States
Many major metros sit near or above a ratio of 20, with coastal cities New York, San Francisco, Seattle, Boston showing the most stretched numbers, while Midwest and Southern metros run closer to parity. Federal Reserve data tracks the mortgage-rate side of this story closely, and the distinctly American wrinkle sits on the cost side: climate-driven insurance premium increases in Florida, California, Louisiana, and Texas have added anywhere from $3,000 to $8,000-plus a year to ownership costs in some markets, an expense the basic ratio never accounts for. Buyers with a 7–10-year-plus horizon, steady income, and strong credit are best positioned in lower-ratio metros like Indianapolis, Columbus, or Kansas City. In high-ratio coastal markets, break-even can stretch to 8–12 years or more.
United Kingdom
Prices remain elevated relative to rents, most acutely in London and the South East, where average private rents across England reached roughly £1,300–£1,400 a month by mid-2026, per ONS house price data. Two things make UK ownership costlier than the ratio suggests: Stamp Duty Land Tax adds a meaningful upfront cost, and mortgage rates remain above pre-2022 levels even as they gradually ease. Sustained rental demand from priced-out or cautious would-be buyers keeps rents firm, but buying still carries a real monthly premium in most urban markets. Buyers outside London, first-timers using government schemes, and those with a long horizon and a solid deposit are in the strongest position and the Stamp Duty calculation is worth timing carefully given how much it can shift with policy changes.
Canada
Toronto and Vancouver have posted some of the highest price-to-rent ratios in the world for years. Rental asking prices softened in some areas through 2025–26 as new supply arrived, according to CMHC market data, which improved the ratio slightly for renters without doing much for buyer affordability. Property taxes and insurance add real weight to true ownership cost, mortgage stress-test rules affect how much buyers can qualify for, and the gap between big-city and secondary-market ratios has only widened. Calgary, Edmonton, and smaller Ontario markets show meaningfully better numbers; Toronto and Vancouver keep long break-even periods as the norm.
Germany
This is the market where the basic ratio fails most completely. Purchase-side transaction costs transfer tax, notary fees, agent commission typically run 10–15% of the purchase price, which changes the entire break-even calculation before you’ve even looked at rent. Fixed rates on new German mortgages, tracked by the Deutsche Bundesbank, currently sit in the mid-3% range more accessible than in several other markets covered here but the transaction-cost burden usually means 7–10-plus years of ownership before buying in Berlin or Munich pulls ahead of renting. German renters also benefit from strong tenant protections, which makes renting a legitimate long-term choice there rather than a fallback.
Russia
Moscow and St. Petersburg show high absolute rents and prices, with mid-single-digit rental yields typical in both cities. The number the ratio can’t capture is the policy rate: Russia’s central bank rate remains very high in 2026, which makes conventional mortgage financing expensive and puts it out of reach for most buyers outside subsidized programs. For buyers without access to those programs, true financing cost runs well above what the ratio alone implies and applying standard Western benchmarks here will lead to the wrong conclusion.
Want to see where your own city lands? Our free 2026 Rent vs Buy Decision Checklist calculates your local price-to-rent ratio and personal break-even point in a few minutes.
What Actually Drives the Rent vs. Buy Decision in 2026
The ratio is a starting point, not a conclusion. Five things matter more.
1. Full Monthly Cost, Not Just the Mortgage
Add property tax, insurance, a maintenance allowance, and any HOA or condo fees to the mortgage payment, then compare that total not the mortgage alone to local rent for a similar home. That gap is the real signal.
2. Your Actual Time Horizon
Transaction costs get amortized over however long you stay. Under 4 years, renting almost always wins financially. Between 4 and 7 years, it’s genuinely close and worth a careful calculation. Over the past 7 years, ownership tends to win unless the monthly cost gap is extreme. This shifts by market in Germany, for instance, the break-even point runs longer because transaction costs are higher to begin with.
3. What Happens If Rates Move
Run your numbers at your current rate, then at plus-one and minus-one percentage point. If the decision to buy only works at the lowest of the three, that’s a reason to wait or reconsider. If it holds up across all three, you’re on firmer ground.
4. The Opportunity Cost of the Down Payment
Money tied up in a deposit isn’t available to do anything else. A $60,000 down payment invested instead, at typical long-run market returns, adds up over a decade worth weighing seriously if local price appreciation looks uncertain.
5. What’s Happening Locally That the Ratio Can’t See
New rental construction easing rent growth, rent control caps, property tax reform, zoning changes that affect future appreciation none of it shows up in a price-to-rent number, and any one of these can outweigh everything else in the calculation.
A Five-Step Rent vs. Buy Framework for 2026
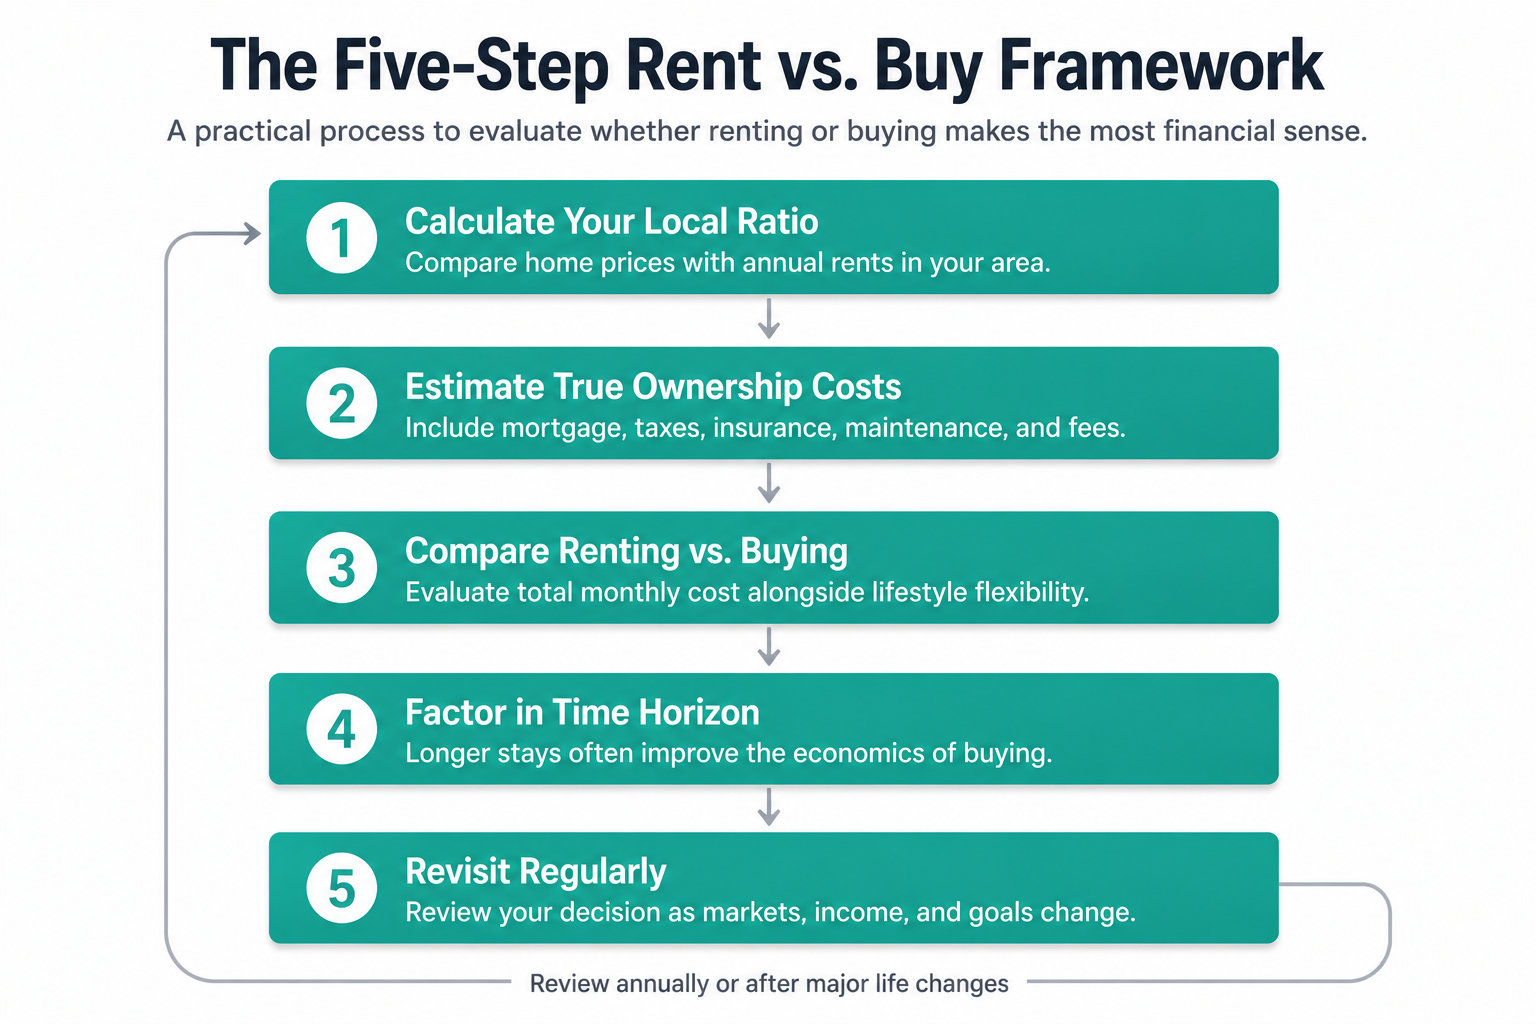
- Calculate the ratio for your actual neighborhood, not your city, not your country average.
- Run the full monthly cost comparison: mortgage, tax, insurance, maintenance, fees against current local rent for something comparable.
- Work out your personal break-even point of how many years of ownership, adjusted for equity built, before it beats continued renting. A basic spreadsheet will get you there.
- Adjust for your own situation, job stability, family plans, how likely you are to move, and how much risk you’re comfortable carrying.
- Revisit it periodically. Rates, rental markets, and tax rules all move. A decision that doesn’t pencil out today might in twelve months, or the reverse.
Frequently Asked Questions
- Is the price-to-rent ratio still worth calculating in 2026?
Yes, as a first screen. Under 15 still signals buying deserves a closer look; above 25 still leans strongly toward renting, particularly with rates where they are. Neither threshold is reliable on its own pair it with the full cost comparison above before deciding anything.
2. Does a low ratio guarantee buying is the right call?
No. A ratio under 15 can still lose out once you add current mortgage rates and the full run of ownership costs insurance, maintenance, tax on top of it. Some lower-ratio Midwest US markets do clearly favor buying right now; others with the same ratio don’t, once rates are factored in.
3. Which of these five markets looks most favorable for buyers right now?
Some smaller US metros parts of the Midwest and South currently show the most buyer-friendly numbers. Germany has lower headline ratios in places but offsets them with high transaction costs. The UK, Canada, and Russia all run elevated in their major cities. The honest answer depends far more on your specific city and finances than on any national comparison.
4. Should I wait for rates to drop before buying?
It depends on whether prices are likely to rise faster than rates are likely to fall in your market. Where they are, waiting can end up costing more than acting now; where the market is flatter, waiting for better rates is often the more sound call. Model both scenarios with your local numbers rather than a general rule.
5. How do I calculate this for my own city?
Take the median sale price for a home like the one you’re considering, and the median rent for a genuinely comparable property same size, same type. Multiply the monthly rent by 12, then divide the home price by that figure. Comparing a three-bedroom purchase to a one-bedroom rental will just give you a meaningless number.
6. Can this ratio be used to evaluate a rental investment instead of a home purchase?
Yes flip it around. Rent-to-price ratio times 100 gives you gross rental yield, so a price-to-rent ratio of 15 works out to roughly a 6.7% gross yield. From there, factor in vacancy, management, maintenance, and financing costs to get to a net figure before treating it as a real investment case.
7. Is it cheaper to rent or buy right now in 2026?
In most major markets covered here, renting is cheaper on a monthly cash-flow basis once full ownership costs are included mortgage rates and non-mortgage expenses like insurance and maintenance have pushed the true cost of owning above rent in most cities. Buying can still come out ahead over a long enough horizon, typically 7 years or more, where equity built and any price appreciation offset the higher monthly cost. The honest answer depends on your specific city, your time horizon, and your own break-even math rather than a single global rule.
8. How much should I have saved before buying a home in 2026?
Beyond the down payment itself, budget for closing costs which can run 10–15% of the purchase price in markets like Germany and several percent in others plus a cash buffer for the maintenance and insurance costs the price-to-rent ratio doesn’t capture. A common starting point is a 20% down payment (to avoid mortgage insurance in markets that charge it) plus 3–6 months of full ownership costs held in reserve, though the right number depends heavily on local transaction costs and your mortgage terms.
The Bottom Line is..
The old 15/20/25 rule made sense in a very different rate environment. That environment is gone, and the rule hasn’t caught up.
The price-to-rent ratio 2026 still has a use as a first filter, nothing more. Under 15 is worth a closer look; above 25 leans hard toward renting. But the real decision runs through five things the ratio can’t see on its own: your true monthly cost, your actual time horizon, what happens if rates move, what your down payment could otherwise be doing, and what’s shifting locally in supply and policy.
That’s more work than checking one number. It’s also the only version of this decision that’s actually grounded in 2026 not in assumptions left over from a different market.
Want a tailored read on your specific city and financial situation? Request a free, short rent-versus-buy review from our team.
